USDA/Flickr (Public Domain)
Listen: Nebraska FARMcast
Most people prefer avoiding risk, all else being equal. However, taking greater risks tends to lead to greater rewards. How much risk are you willing to accept for a chance or opportunity to earn $100? $1,000? $10,000? Does it make a difference to you what the odds are of earning the reward? Does it make a difference if you are putting cold hard cash on the line or just your time and/or non-cash resources? People’s tolerance for risk varies and it is important to understand what it is, especially when multiple people within an organization are making decisions on a regular basis.
People are classified into three basic types of risk preference. Individuals who make decisions to maximize expected outcomes are classified as risk neutral. Individuals who intentionally seek risk, such as someone who loves gambling, are classified as risk-loving. Most people are risk averse to some degree, meaning they are willing to forgo some potential rewards to avoid risk.
In operations with multiple decision makers, it is important to know where everyone stands regarding their comfort level with risk. Some people are surprised to know that their agricultural business partner (i.e., sibling, parent, child, spouse, etc.) have a much different view of taking risks. However, knowing it is more important than controlling it. Knowing it allows the decision-makers to utilize and exploit each other’s strengths to take advantage of opportunities while minimizing negative impacts.
I was part of a team of agricultural educators who put together a book called Applied Risk Management in Agriculture based on a 10-step strategic risk management (SRM) process. Step two of the SRM process was to Determine Risk Preferences. One of the tools we developed for that step was called the Risk Preference Calculator. It is available online at http://www.risknavigatorsrm.com/toolbox/Risk%20Preference%20Tools/default.aspx.
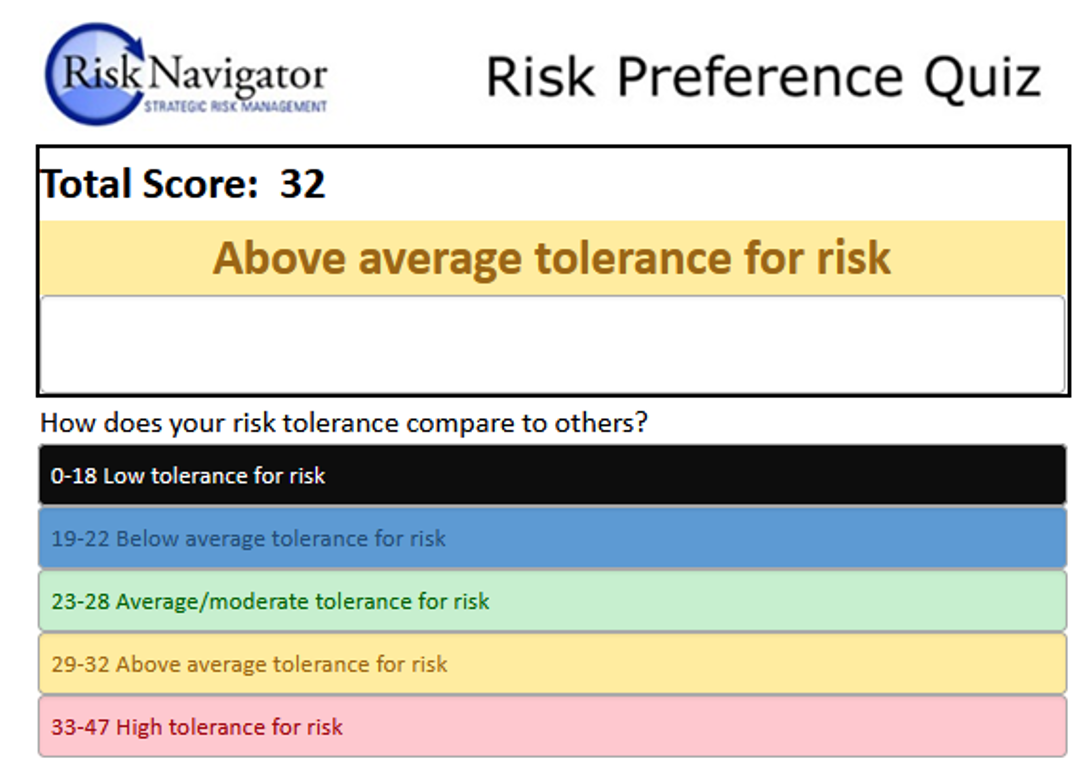
One of the main features of the Risk Preference Calculator is a quiz people can complete to determine where they fall on a risk preference scale ranging from a low tolerance to a high tolerance for risk (Figure 1). The quiz is 13 questions long and is just one way to see how you compare to a colleague or fellow decision-maker. Having used the quiz in several classes and extension workshops over the last dozen years, I have seen some interesting results.
Several times married couples have taken the quiz independently and discovered for the first time they have very different preferences for taking risk. In fact, one time, we had to take a 15-minute break from a class I was teaching so one couple could discuss their differences in private. Having differences is not necessarily a bad thing. In fact, it can be a good thing if the people involved learn to exploit each other’s strengths to manage risk. For example, putting a risk-loving person in charge of exploring and finding new marketing outlets. This can sometimes be a job resulting in a lot of dead ends. A risk-loving person is more likely to take these failures with a grain of salt and move on to exploring the next opportunity.
Another observation is that people tend to self-assess themselves as much more risk-averse than their quiz score indicates. For example, workshop participants were asked to self-assess their tolerance for risk at the 2016 Nebraska Women in Agriculture Conference. Fifty-seven percent of the participants self-assessed themselves as having either a low or below-average tolerance for risk. Thirty-five percent said they had an average tolerance for risk and only 9% assessed themselves as having an above-average tolerance for risk. Nobody said they had a high tolerance for risk. All participants then took the Risk Preference Quiz and reported their scores. The results were only 23% reported a score of either low or below tolerance for risk, 54% reported an average tolerance for risk, 13% reported an above average tolerance and 13% reported a high tolerance for risk.
In general, men are more likely to have a high tolerance for risk than women. This is especially true for college students. Males outnumbered females in the high tolerance for risk category by 10:1 and 7:1 in 2020 and 2021, respectively, when reporting scores on the Risk Preference Quiz in the advanced farm management course at the University of Nebraska-Lincoln. While this result is not surprising for college age participants, it is important to realize what risk preferences are at a given point in time and how they can change over time as roles and responsibilities change. Reassessing the risk preferences of decision-makers periodically and keeping an open dialogue about tolerances for risk can help put the organization in the best position to succeed.
Figure 1: Risk Preference Calculator Risk Preference Quiz Results Screen Example.
(Note: Depending on the browser, users may need to scroll up to see their score on the results page.)