Real Ag Stock
Listen: Nebraska FARMcast
Survey findings from the USDA-National Agricultural Statistics Services (USDA-NASS) estimated that Nebraska farm real estate value, including all agricultural land and buildings, in 2023 increased by 13.1% to an average of $4,240 per acre (Figure 1). The year-over-year increases mark an increase of $490 for this annual period (USDA-NASS 2023a). Kansas and New Jersey lead the nation for the highest rates of increase in the market value of farmland at 16.3% and 14.9% for market value averages of $3,060 and $17,700 per acre. Nebraska marked the fifth-highest percentage increase for rising farm real estate when ranked against the other states.
Figure 1. 2023 Farm Real Estate Values by State
 Source: Land Values 2023 Summary; USDA-National Agricultural Statistics Service, August 4, 2023.
Cropland values in Nebraska reported the third-highest increase in the nation at 13.8% to an average of $6,830 per acre. New Jersey also reported an annual gain of 13.8% to an average of $18,100 per acre. Kansas led the country with a rise of 16.6% to a new average of $3,440 per acre (USDA-NASS 2023a). Many of the cropland purchases capitalized on the high commodity prices across the major grain-producing regions of the United States. Monetary policies gradually increased the cost of financing land purchases during 2023 to combat inflationary pressures. Rising interest rates, input expenses, and commodity prices backing off near record price levels may weigh down on future cropland values unless offset by increasing farm profitability.
Pasture land values increased at a higher rate than cropland across Nebraska as parts of the state experienced prolonged drought in 2023. Year-over-year pasture land gained 16.1% to a new average of $1,440 per acre in Nebraska. Disaster assistance helped offset some of the drought pressures on cattle producers. Higher cattle prices help the financial situation of many livestock producers, but feed and forage expenses remain tight for many operations. Culling breeding stock or acquiring additional forages were some of the strategies utilized by livestock producers to deal with drought pressures. This approach may have financial impacts on the operation and outlook on profitability for the industry.
The USDA-National Agricultural Statistics Service also reported county-level cash rent estimates for the 2023 growing season in Nebraska (USDA-NASS 2023b). These estimates include cash rent averages for non-irrigated and irrigated cropland along with pasture on a per-acre basis. Differences in non-irrigated cropland rental rates in Nebraska are attributable to differences in soil type, rainfall, yield expectations, and general market competitiveness of different counties (Figure 2). Counties indicated in white did not have enough surveys returned by participants to estimate a rate or be in an area of the state with a low rate of a particular production practice.
Figure 2. 2023 Nebraska Non-Irrigated Cropland Cash Rent Paid Per Acre
 Source: 2023 Nebraska Cash Rents by County; USDA-National Agricultural Statistics Service, August 25, 2023.
Trends reported for irrigated cash rental rates in 2023 reflect those reported for non-irrigated cropland (Figure 3). Higher cash rental rates for irrigated cropland are noted in the eastern half of Nebraska compared to the western region. Irrigated areas with low response rates to the cash rent survey or those with low numbers of irrigated acres did not report rates. The irrigated cash rental rates do not distinguish between center pivot, gravity, or flood irrigated acres. The reported irrigated average reflects a weighted average of the county's center pivot, gravity, and flood irrigated practices. The reported rates also assume the landlord owns the entire irrigation system on the property leased to the tenant. Rates may be adjusted when the tenant provides the pivot, power unit, or other irrigation system components.
Figure 3. 2023 Nebraska Irrigated Cropland Cash Rent Paid Per Acre
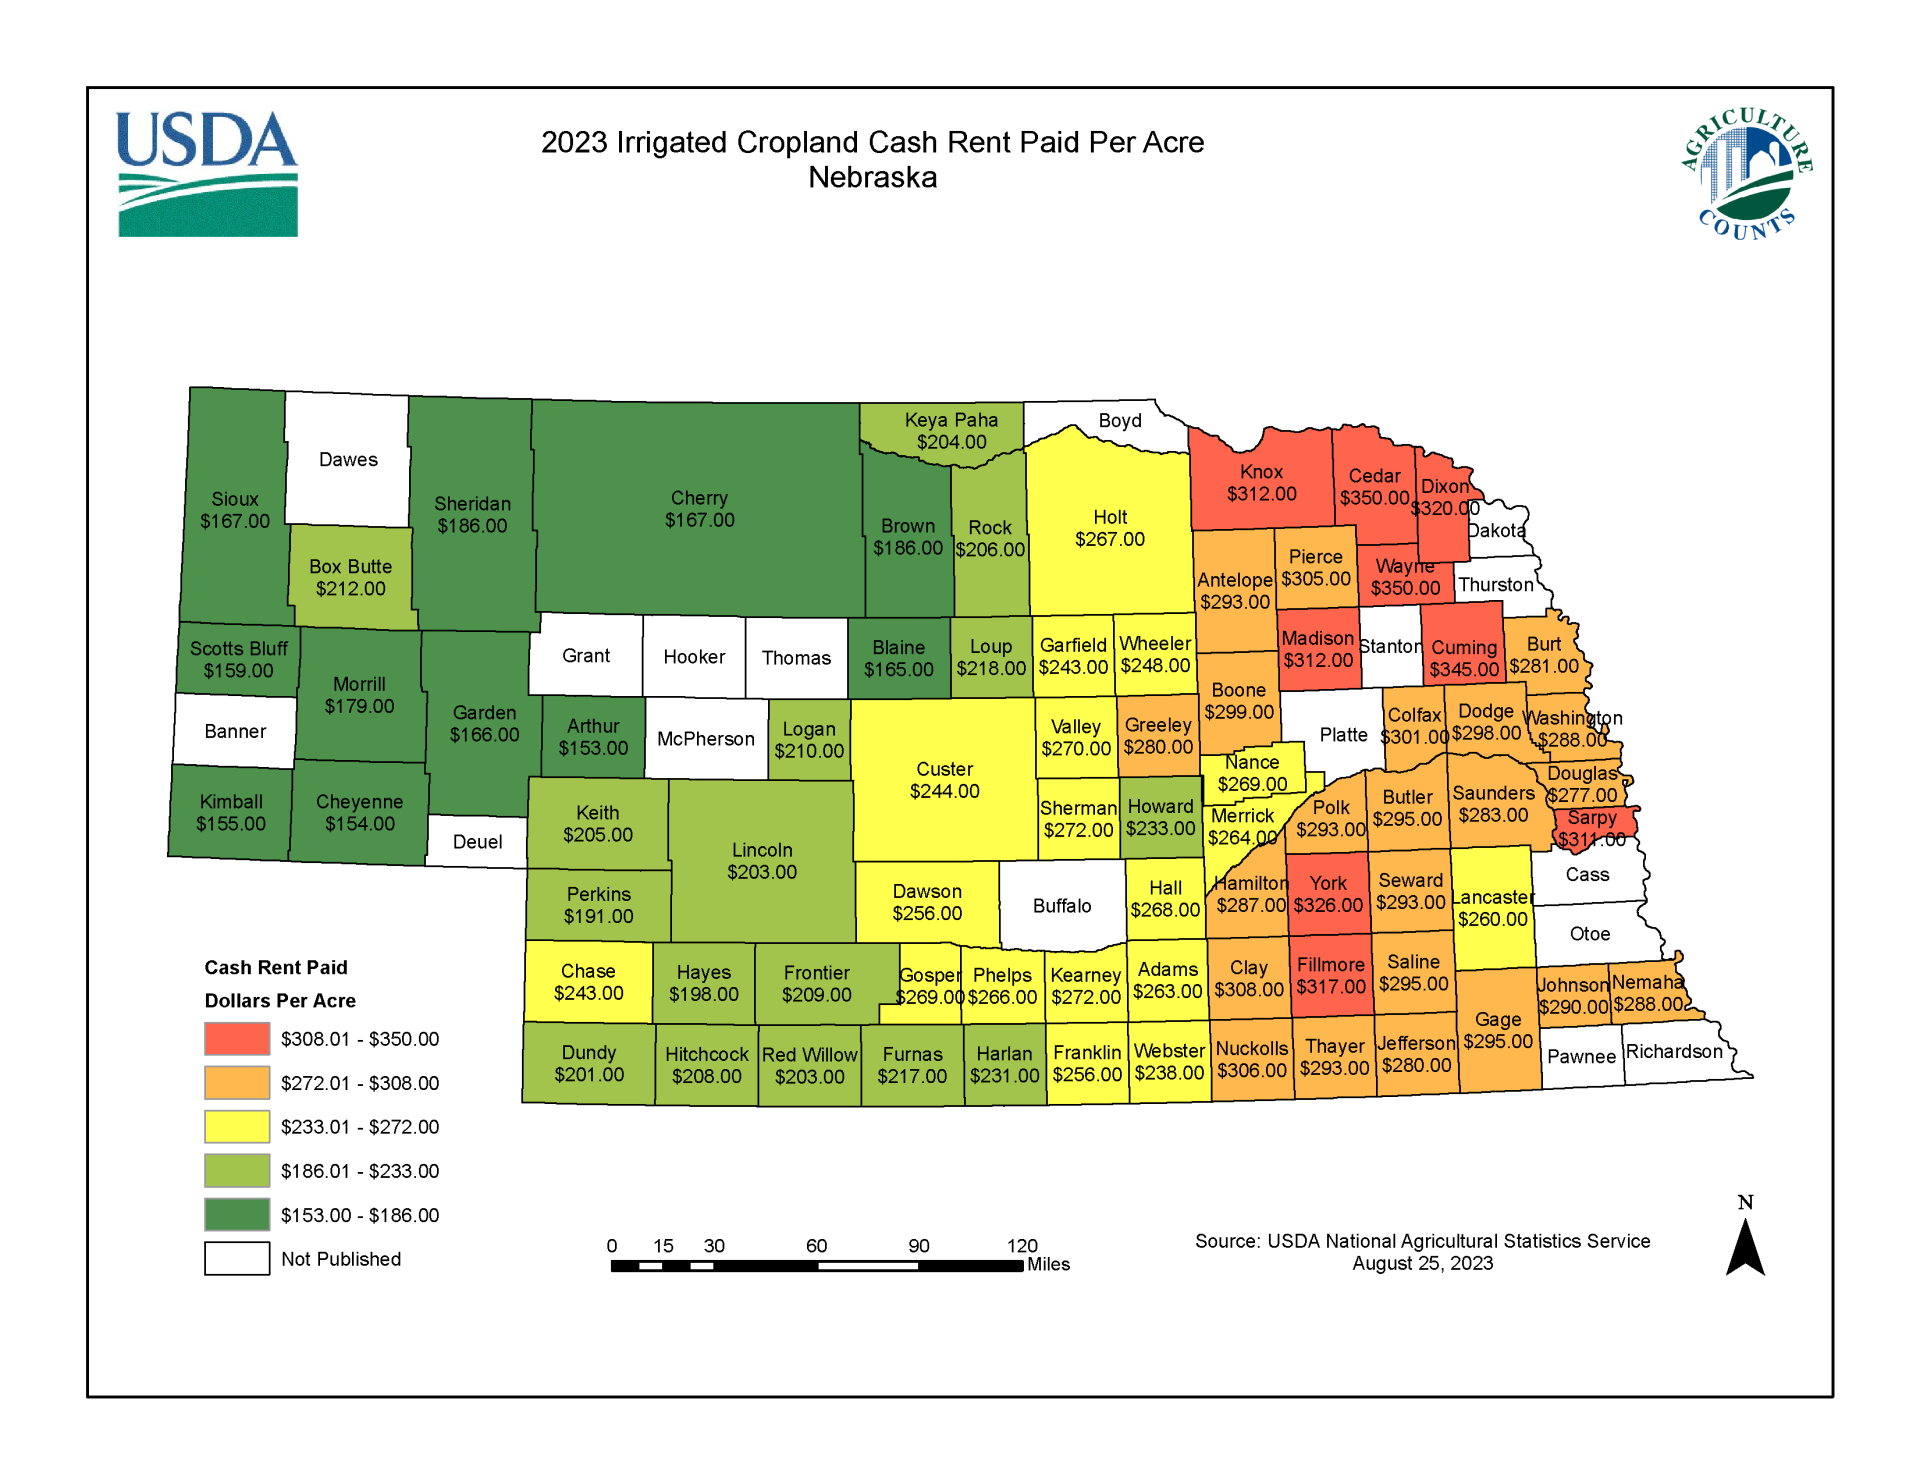 Source: 2023 Nebraska Cash Rents by County; USDA-National Agricultural Statistics Service, August 25, 2023.
Nebraska's land and pasture rental rates reflect the differences in stocking rates, productivity, and market competitiveness (Figure 4). Reported rates reflect the amount paid during the summer. Off-season grazing rental rates during the fall, winter, or spring calving season may be adjusted to reflect forage dormancy, quality, or other property features. This off-season period may also be adjusted by winter snowfall or other weather features.
Figure 4. 2023 Nebraska Pasture Cash Rent Paid Per Acre

Source: 2023 Nebraska Cash Rents by County; USDA-National Agricultural Statistics Service, August 25, 2023.
Additional details on the USDA-National Agricultural Statistics Service land values and cash rental publications may be found in the reference section of this article.
Jim Jansen, (402) 261-7572
Agricultural Economist
University of Nebraska-Lincoln
jjansen4@unl.edu
Jeffrey Stokes, (402) 472-2127
Professor of Agricultural Economics
University of Nebraska-Lincoln
jeffrey.stokes@unl.edu
References
USDA-National Agricultural Statistics Service. (2023, August 4). Land Values 2023 Summary. Retrieved September 8, 2023, from: https://usda.library.cornell.edu/concern/publications/pn89d6567.
USDA-National Agricultural Statistics Service. (2023, August 25). 2023 Nebraska Cash Rents by County. Retrieved September 15, 2023, from: https://www.nass.usda.gov/Statistics_by_State/Nebraska/Publications/County_Estimates/.